It was the first arrest in the country in connection with an illegal operation of a drone near an airport.
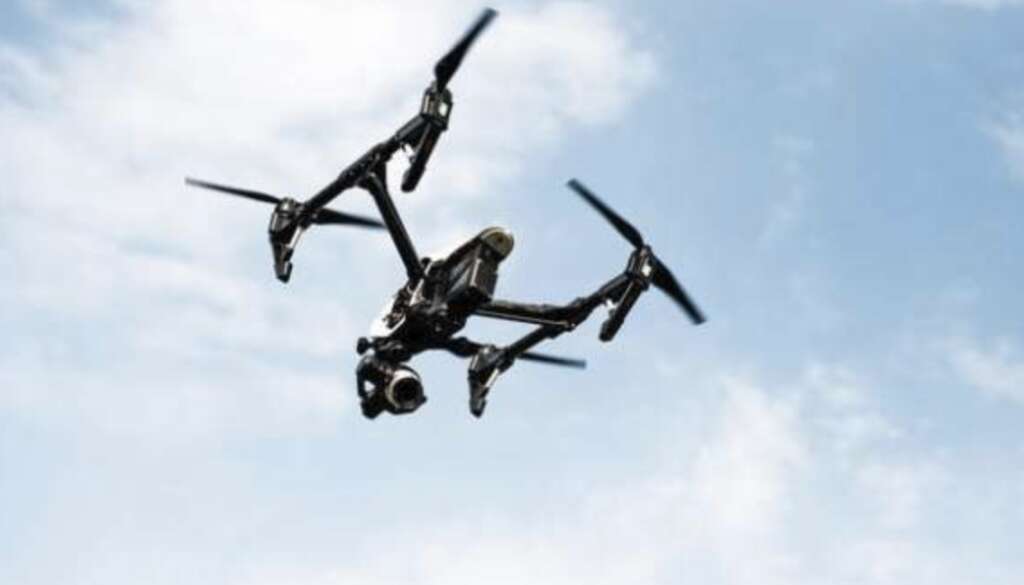
Sri Lankan authorities arrested four Maldivian nationals, including a woman, for illegally operating a drone near the country’s main international airport, police said on Sunday.
The suspects were taken into custody on Saturday night after they were seen using a drone within the high security zone of the Bandaranaike International Airport (BIA), police said in a statement.
“They were filming the airport area with the drone. Investigations are continuing,” police spokesman Ruwan Gunasekera said. “The suspects – aged between 19 and 23 – will be produced before a magistrate today.”
It was the first arrest in the country in connection with an illegal operation of a drone near an airport.
The incident came hours before Maldivian President Ibrahim Mohamed Solih was due to arrive in Sri Lanka to attend the country’s 71st national day ceremony in Colombo.
Operating any kind of drone near airports is banned while drone photography and aerial mapping are also highly regulated by civil aviation authorities.
Air traffic controllers at the BIA said there were no disruptions to international flights on Saturday.
However, drones have caused flight disruptions in recent weeks in London and New York.
App in the Air can help travelers predict wait times for TSA security lines. App in the Air
Airport security lines can behave like curly hair: One small change in the atmosphere and everything can go out of whack. Weather, holidays and most recently the partial government shutdown have turned a routine procedure into a panicky production.
The Transportation Security Administration and airlines advise domestic passengers to arrive at the airport at least 90 minutes before their departure time, or even earlier during peak or atypical travel periods. Toward the end of the 35-day governmental crisis, some airports were reporting above-average wait times, such as Atlanta’s Hartsfield-Jackson International Airport (42 minutes) and Baltimore-Washington International Marshall Airport (37 minutes).
Over the years, several companies and one federal agency have introduced apps that provide travelers with average security line wait times. The numbers are crowdsourced by other passengers or are based on historical data — or are a mix of both. With another possible shutdown looming (the stopgap bill expires on Feb. 15) and spring break on the horizon, we decided to test the timekeepers at three airports. Here are our results.
The apps:
In my initial online research, I discovered six apps that promised to deliver security line wait times. However, upon deeper investigation, three were operating, two appeared to have gone out of business and one (Kayak) dropped the feature.
MiFlight was as simple and straightforward as a Casio watch that has one job to do: relay the time. Type in the airport and select the terminal, and the wait time will pop up in large-print digits. Bonus eye candy: an attractive backdrop photo of the destination, such as the U.S. Capitol for Reagan National Airport, a beach sunset for Miami and a Mardi Gras reveler for New Orleans.
MyTSA, which is run by the agency, lists the archival wait times for every day of the week, plus one-hour increments from midnight to midnight. It also offers a handy histogram for procrastinators who are trying to reform their race-to-the-gate habit. The app also posts submissions from passengers at the airport. To stay relevant and accurate, the app will retain the times for only two hours.
App in the Air wants to be “your personal travel assistant,” a helpful tool if you need someone (or thing) to organize your travel schedule but a bit intrusive if you just want time-management guidance. After allowing the app to access my reservations, I had to click on my flight and departure airport to see the wait times for check-in, passport and security. To peruse an airport out of sheer curiosity, I had to plug in a pretend flight.
The findings:
A few hours before my early-evening departure last Thursday, I checked all three apps. The times for Reagan National were “less than 15 minutes” (MyTSA), “30 mins” (MiFlight) and “10 minutes” (App in the Air). Unfortunately, I had to disqualify the last entry because “10 minutes” was App in the Air’s default mode. In an email, co-founder Nikita Kosholkin explained: “The 10 min mark is set by default when we don’t have enough data for the particular line. The data you see is currently an average for the airport (hence, there is no timestamp), but we do have plans to show wait times linked with your departure time in future updates.” (I later noodled around with other airports and discovered some useful results, such as a 23-minute wait at Dulles International Airport and 19 minutes at New York’s JFK.)
At the airport, I opened the apps again. On MyTSA, one traveler had reported a wait of “one to 10 minutes.” MiFlight had dropped down to 10 minutes. For this exercise, I joined the regular line instead of PreCheck. (MyTSA provides estimates for the trusted traveler queue; the others don’t.) I started the stopwatch right after showing my boarding pass to the official at the entrance of the line and stopped it after collecting my bags on the other side. Total time: 12 minutes 15 seconds, not counting the bag check triggered by my container of mango. Before heading to my gate, I tried to report my wait time, but unfortunately I could not find the option on the screen. (Sharing is much easier on MiFlight. Scroll down for the timer, then press “Share Time.”)
For additional testing, I roped in two other travelers, loaned to us by a colleague. Her husband was flying out of BWI on a Friday morning, the day the government ended the shutdown. The apps reported “standard wait times are typically 15-30 min” (MyTSA), “30 minutes” (MiFlight) and “10 minutes” (App in the Air). The actual wait time was 13 minutes. Her daughter departed from Cleveland Hopkins International Airport on Sunday afternoon. The apps posted less than 15 minutes, 30 minutes and 10 minutes, respectively. She whizzed through security in 12 minutes.
The lesson:
Based on our sampling, MyTSA was the most accurate, especially when the times came from real-time travelers. The other apps could be useful if they were more transparent with their sources of information. In this era of busier skies, stronger storms and record-breaking shutdowns, stopwatches-on-the-ground are a better time gauge than historical data. So, passengers, help out your fellow travelers: Start your clocks and send in those minutes
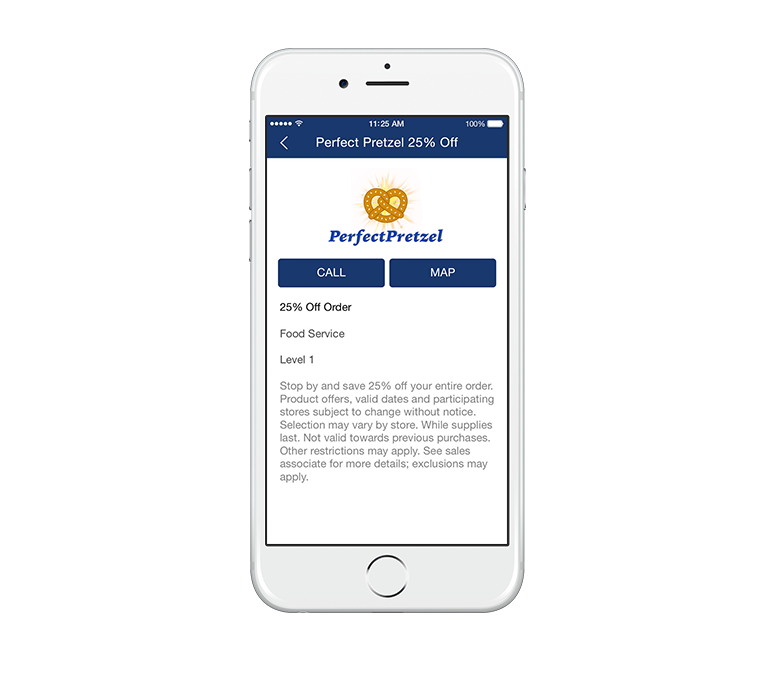
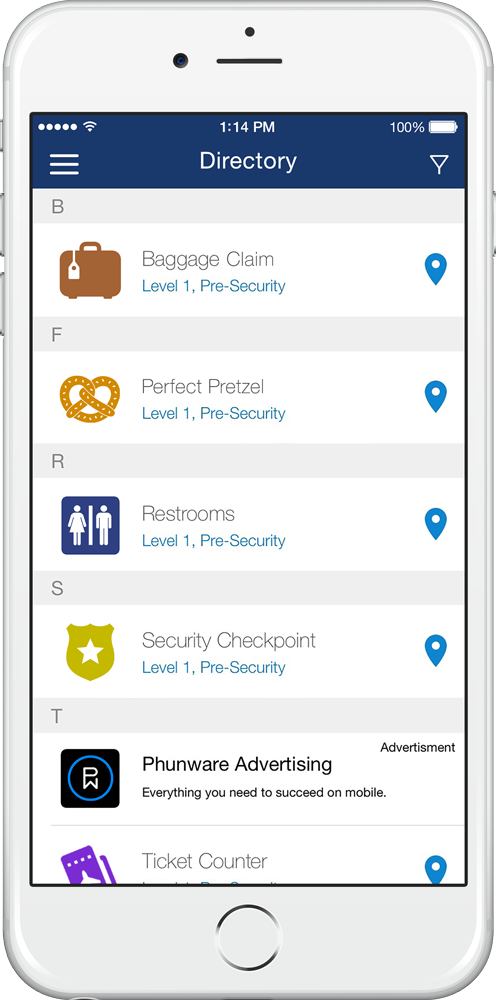
Phunware’s brandable, location-aware mobile apps for iOS and Android help passengers navigate in the terminal with GPS-like guidance to shops, restaurants, amenities (and of course, the departure gate). They also provide on-demand information about flights, concessions, retailers and more, keeping passengers informed and relaxed.
Phunware’s mobile solutions don’t end with the passenger, though: powerful behind-the-scenes tools make it easy for businesses in and outside the terminal to drive foot traffic and engage travelers with location-based promotions and offers. Download the feature sheet to learn more.
Mobile-Powered Passenger Experience
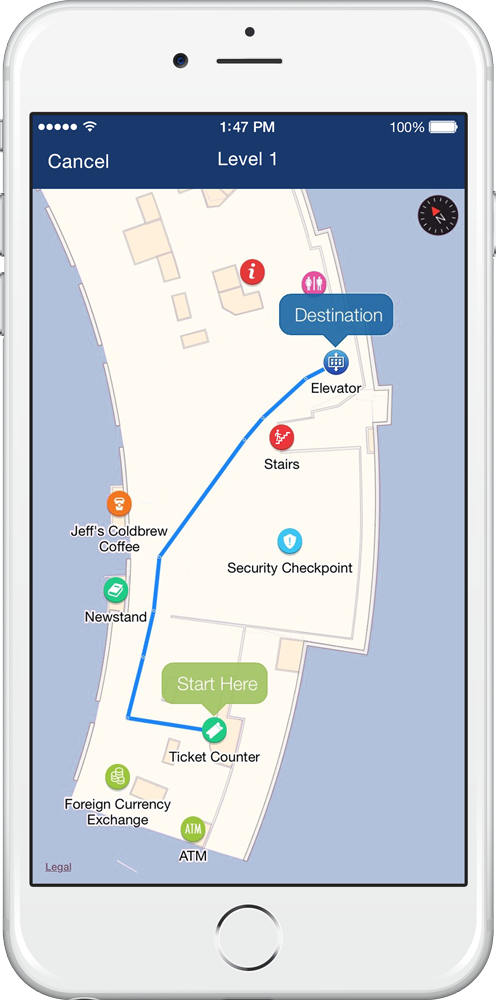
Real-time Indoor Navigation
Advanced mobile wayfinding capabilities with turn-by-turn directions help passengers find their gate, their favorite coffee shop, the closest book store or any other destination within the airport.
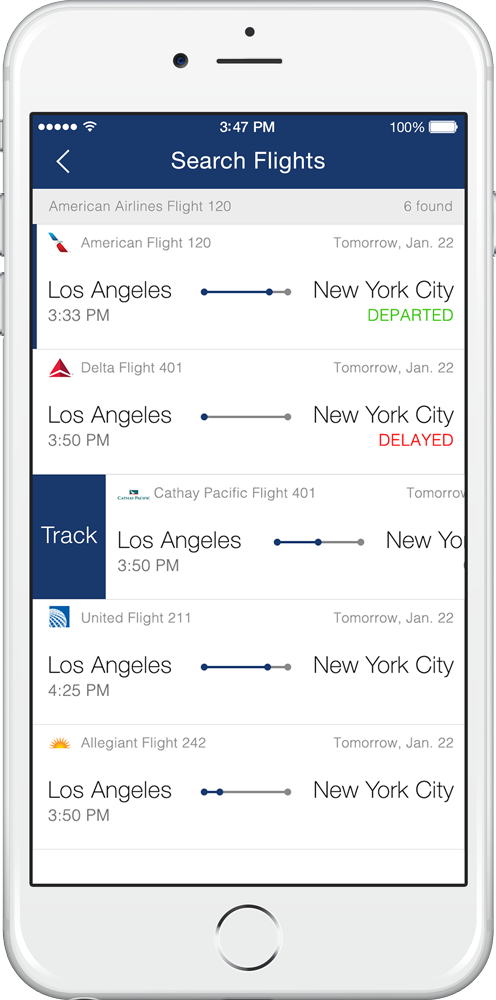
Flight Tracker
Give passengers on-demand information about flights, delays and gate changes.
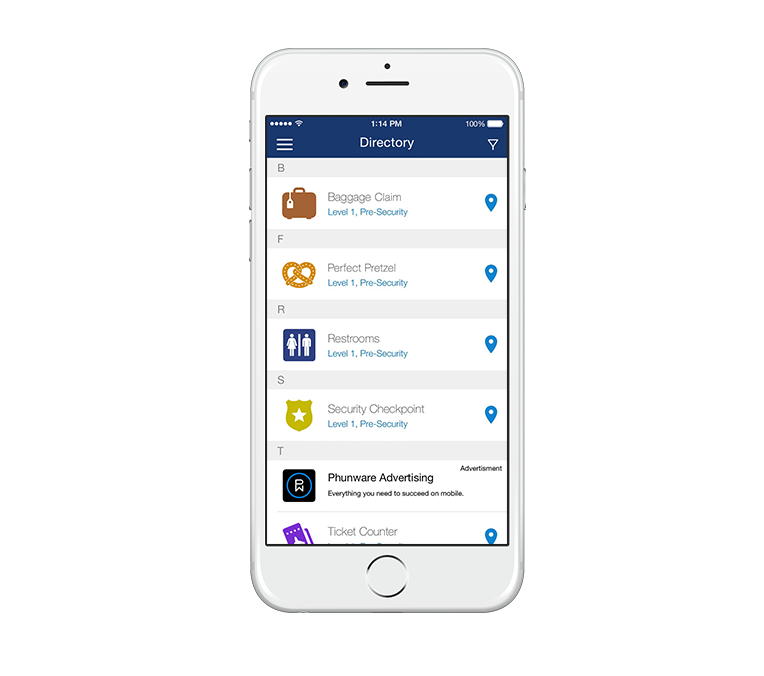
Interactive Directories
Concessionaires, retailers and services are listed in interactive directories with one-tap navigation.
Promotions
Increase in-airport spending through location-aware promotions that drive passengers to nearby retailers and concessionaires.
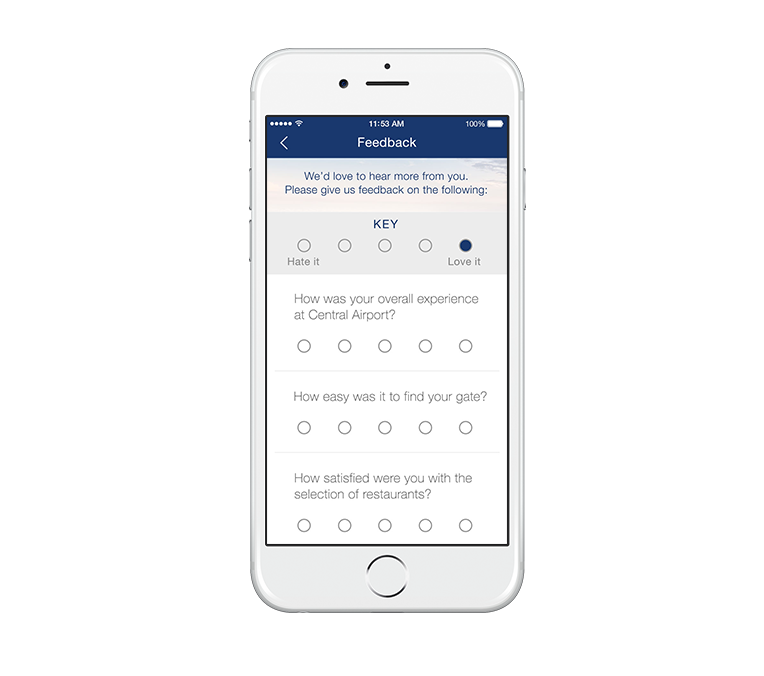
Surveys and Feedback
Passengers can leave feedback and complete surveys in the app.
If we can successfully unleash data from the new generation of connected aircraft, then we can totally transform airline operations, from maintenance to flight safety.
It’s an exciting time as our industry begins to create more and more value from aircraft data, delivering intelligence and analysis that will transform operations. At SITAONAIR, we’re starting to see the realization of great potential from this data.
Big data and analytics: opening possibilities
Using big data and analytics together with secure communications capabilities opens up a host of possibilities to monitor an aircraft’s components and on-board equipment. Real-time data enables aircraft operators to apply predictive maintenance to monitor braking parts, for example. More than that, analytics can improve fuel usage, as fuel is one of the biggest expenses for airlines. The big challenge, however, is extracting relevant data and making it useful.
A growing goldmine of insights
By 2034, the commercial aircraft fleet will double. Of the 43,000 that will be flying, 85% will be new generation models. Let me give you an idea: the Airbus A350 has approximately 6,000 sensors across the entire plane and generates 2.5 terabytes of data a day. The new model expected to take to the skies in 2020 will capture triple this amount of data!
New-generation aircraft will incorporate an unprecedented number of connected technologies. They’ll churn out colossal amounts of telemetry and data. This amount of aircraft data will undoubtedly be a challenge for the aviation industry – but it’s also a goldmine of valuable insights for operators. As an industry we must rise to this challenge.
First off, don’t lose your valuable aircraft data!
Data can be unlocked from every part of the aircraft – the cockpit, cabin and aircraft engines – to enhance performance and service. But to achieve this there must be effective data management. Only then can we retrieve meaningful information. Accessing this data is complex and airlines can lose up to 25% of their aircraft data due to inefficient management.
Airlines have also been reluctant to permit OEMs access to sensitive data, and the complexity of achieving timely and tailored secure data transfer and distribution to relevant parties.
To overcome this problem, SITAONAIR has developed e-Aircraft DataHub, a secure cloud-based data brokering and transformation service for Original Equipment Manufacturers (OEMs). Aircraft data is crucial to the improvement of OEM services going forward.
Rolls-Royce, for example, is using e-Aircraft DataHub to work collaboratively with airlines on end-to-end aircraft engine management. OEMs can be confident that they’re receiving trusted, on-time data, delivered in a practical way. By optimizing the collection of data, Rolls-Royce and airline engineers will be able to organize the maintenance and servicing of their engines more efficiently to make better use of the aircraft’s time on the ground.
Making sense of the complex data
By acting as a secure, neutral data-broker between an OEM and an airline, e-Aircraft DataHub keeps the control and ownership of aircraft data firmly in the airline’s hands, while providing OEMs with greater insight to drive mutually-beneficial enhancements of their products. No other solution on the market puts airlines in control of their data sharing with third parties in this way.
The solution collects various types of unstructured data in different formats from operators’ ground servers and agreed external sources. It’s then classified, decoded, stored and enriched. This, now structured, data is sent to the OEM through an Application Programming Interface (API) via specific industry software decoders embedded in the core of the platform. Data is retrieved via an easy-to-use web portal.
Leading the push to digitally transform aircraft operations
SITA currently bridges as much as 60% of the industry’s data exchange, among airlines, airports, aircraft and border agencies. e-Aircraft DataHub brings the power of data to the OEM, allowing them to turn data into insights and predictions for airlines. The solution will enable airlines to minimize disruption and optimize efficiencies.
Big data is rapidly changing the face of aviation as we know it.The ability to monitor and improve operations will inevitably make aircraft safer and make operations far more efficient than ever. The big challenge is to harness this data without increasing complexity and creating a hurdle to future advancements. Collaboration and sharing are in SITA’s DNA. Becoming an ‘Aircraft DataHub’ is well suited to this.
For more
SITAONAIR e-Aircraft DataHub
Rolls-Royce selects game-changing SITAONAIR e-Aircraft DataHub for airlines
Waiting in line is considered by some to be almost as bad as torture, but it’s one of life’s inevitabilities. But, what if there was a way to make airport queues move faster and keep the experience more pleasant for those in line? It all comes down to understanding why queuing is so painful, and doing something about it. By Christian Bugislaus Carstens, Marketing Manager, Veovo, BlipTrack
No matter how carefully you have planned your business trip or vacation, from arriving early to check in, to paying that little extra for priority boarding, you can’t do anything about bottlenecks, delayed flights or other hold-ups. Next thing you know, you’re stuck between an irritated business traveller who’s worried about being late for a meeting, and a mother with three tired, cranky children who want to go home. And all you can do is stand there.
The pressure is mounting
Long lines are nothing new, but over the last 20 years, things have grown much more pressurised. With more security checks worldwide following 9/11, growth in passenger and flight numbers each year, and limited space to expand their existing infrastructure, modern airports frequently have to contend with lengthy queues of tired, frustrated people.
Airports need to make sure there’s enough staff at various checkpoints, gauge the flow and number of people through the processes and concessions, preferably in real time, and deal with unforeseen events, like delays or severe weather conditions. Add to that the fact that, as passengers, we simply don’t care – it’s not our fault or problem. All of this puts the pressure on airports to revamp the way things are done and come up with better solutions.
The torture of waiting
As a traveller, there are many frustrations you can experience, even before you get there. Traffic delays could mean you arrive feeling frustrated, and worried about missing your flight. Once there, there are all the queues you have to stand in – first check-in, then security, then the interminable queue for boarding, then the whole process in reverse when you land, with lengthy waits at border control, the baggage carousel and taxi rank.
Most international airports have done what they can to minimise these lines, with self-check-in options, self-service bag drop, comfort-lounges, priority boarding and such, but that doesn’t eliminate the need to stand in line. If everything is running smoothly and at top efficiency, things will move reasonably quickly, but when things go wrong, it’s a recipe for extremely agitated passengers.
Just one delayed or late-arriving flight can cause all planning to go entirely out of whack. Suddenly, extra people need to be processed by a limited number of staff. Imagine you are one of the people waiting in an unending line, and only two counters are operating, while six, 10, 15 counters stand unstaffed and inoperative – this leads to immediate irritation and complaints.
Now imagine you have no idea how long this is going to take, and you’re constantly checking the time to see how long it’s been. Even if the queue is moving reasonably efficiently, not knowing how long things will take can be highly frustrating.
It’s not just you
The simple fact is, waiting in line with little to no information and no clear understanding of what’s going on can make you frustrated, angry and stressed, and it isn’t just you. Everyone in that queue is feeling the same pressure and for very good reasons.
Plenty of research has been conducted on the psychology of lines, and most of that research says pretty much the same thing: most of the frustration people experience is caused by boredom and a lack of accurate information. In the case of boredom, having nothing to occupy your mind can make the wait feel much longer than it is. People have been shown to overestimate the length of time spent in a queue by around 36%, which means that boredom changes the way you perceive time.
As for lack of accurate information, when people don’t know how long they can be expected to wait, their frustration immediately increases. They resort to guessing and hoping things will move quickly enough and are caught in a web of uncertainty.
Add in the growing expectation of speedy service, which people have come to expect in the era of instant news, same-day deliveries, and 24-hour service centres, and now impatience has become just as important a factor. People are becoming less willing to wait quietly and patiently, and tend to complain sooner and more frequently than in recent years.
Fortunately, the research has shown two interesting conclusions. Firstly, by providing some form of distraction, airports can help reduce boredom. Secondly, by providing accurate, up-to-date wait-time information, they help travellers feel more in control, thanks to clear expectations.
Innovative solutions
One of the major stumbling blocks to providing accurate wait-time information is how to gather that info accurately. By relying on CCTV cameras and a live monitor to try and accurately gauge where bottlenecks could happen, or where staff are needed to help speed things up, they are working reactively. Bottlenecks are only dealt with once they occur, rather than before they happen. At the same time, they can’t give reliable information about wait times.
New technology, however, is taking the guesswork out of airport operations. All it takes is some strategically placed sensors and the ever-present mobile device.
In contrast to the traditional cameras and human monitors used to gather data, mobile device-detecting sensors allow for real-time, seamless measurement of people flow. When using these methods, management can see, at a glance, where bottlenecks could occur, allowing them to quickly allocate staff to areas where they are needed.
But how does it work? Quite simply, by understanding human behaviour. Mobile devices can be found in possession of just about every single person in an airport, and virtually all will have switched on their phone, or taken it out of flight mode, within moments of landing. It makes the mobile device a truly reliable indicator of how travellers are moving, queuing and using facilities. Don’t worry about your privacy being invaded, though – the system doesn’t identify you via your device; it merely recognises your device’s ID, which contains no personal information.
Best of all, it allows the airport to give you the advantage of clear information, as well as faster, more efficient lines. By displaying real-time wait-time information clearly, these systems have helped reduce numbers of complaints, and even increased positive feedback about the passenger experience.
Adopting the tech
Fortunately for today’s traveller, a SITA survey shows that to date, 42% of airports have invested in queue monitoring technology to give them a clear view of wait times at various pinch points.
In 2015, Terminal 4 at JFK Airport in New York was much like all the other terminals – crowded with passengers, busy 24/7, with the tension and stress of national and international travel hovering in the air like a fog. Keen to improve the situation, they implemented BlipTrack sensors to help travellers get a realistic view of TSA and immigration queue times.
“Nobody likes to wait in lines, and signage helps to manage expectations. Not only does it tell passengers how long they’re going to be standing around, but it also alerts employees about bottlenecks developing, which in turn allows them to react to the situation more quickly,” says Daryl Jameson, Vice President at the company JFKIAT, which runs Terminal 4 at JFK.
In 2015, Terminal 4 at JFK Airport in New York was much like all the other terminals – crowded with passengers, busy 24/7, with the tension and stress of national and international travel hovering in the air like a fog. Keen to improve the situation, they implemented BlipTrack sensors to help travellers get a realistic view of TSA and immigration queue times.
More or less at the same time, Cincinnati/Northern Kentucky International Airport (CVG) turned to the same solution to help reduce frustration and complaints resulting from people’s inaccurate perception of time.
“Much of our interest in the public display of wait times was to dispel perception from reality. As the adage goes, ask five people what their actual wait time was, and you’ll get five different answers. Following deployment, complaints are now rare, as the passenger immediately understands the present situation and adapts,” says Brian Cobb, Vice President of Customer Experience at CVG Airport.
Not only have CVG reduced wait-time complaints, but they’ve also been able to use the collected data to recommend TSA staffing adjustments, resulting in a reduction in processing times by one-third. Auckland Airport has taken the benefits of the technology a step further, by collaborating with road authorities. Besides wait-time information at pinch-point processes, travellers now also get travel time information on the road to and from the airport.
Several other airports have followed suit, and have almost universally experienced a reduction in queue times, as well as complaints.
The next time you travel by air, take the time to look around and see whether the airport you are in has invested in wait time displays to make your journey smoother, more efficient, and stress-free.
Intelligent Transport’s Carol Schweiger, also President of Schweiger Consulting, highlights the technology trends that have the potential to help change mobility in 2019.
1. Creating the ‘complete’ trip
The ‘complete trip’ will be a focus area for the convergence of technology and mobility. It is defined as having a number of components or trip stages that begin with trip planning and end with the traveller’s arrival at their destination. At each stage of the trip, a traveller’s need for information using technology will change. Understanding these needs will grow considerably in 2019. For example, in the U.S., the Accessible Transportation Technologies Research Initiative (ATTRI) of the U.S. Department of Transportation (USDOT) has defined a complete trip as consisting of five major stages. Further, another USDOT effort that is assessing existing standards – and gaps and conflicts in standards associated with multimodal and accessible travel – is breaking the complete trip down into even more stages, including the following:
Before the trip begins (such as trip planning, reservations and trip confirmation)
At the trip origin
Between the trip origin and the first stop/station, such as crossing streets (if applicable)
At station, stop, terminal or park-and-ride location (this stage could repeat if it is a multimodal trip):
Bus stop/transportation network company (TNC) pickup point
Station platform
Bike-share or scooter docking station/dockless bike or scooter location
Car-share location
Station entrance and common areas
Terminal location (including ferry terminals)
Boarding a vehicle/bicycle/scooter/other mobility service
On-board vehicle/bicycle/scooter (could also be repeated if it is a multimodal trip):
Inside tunnel/underground
At surface
Alighting a vehicle/bicycle/scooter/other mobility service
Between stop and transfer location (again can repeat if it is a multimodal trip)
Between final stop and final destination
The need for technology within each of these stages will become better understood in 2019.
2. Curb-side management
The value of the curb, and methods to dynamically allocate and price the curb, will be defined and demonstrated more clearly in 2019. While there has been much discussion over the past few years about how significant an impact curb usage has on mobility, 2019 will bring actual pilot projects that show how to effectively manage the curb. For example, the Institute of Transportation Engineers developed a Curbside Management Practitioner’s Guide “for local jurisdictions on how to inventory, assess, enhance, and prioritize curb spaces to meet the multi-modal demands at the curb in a safe and efficient way.”1 According to the International Transport Forum (ITF), the following three questions will be answered in the near-term2:
Will changes in transport activity – or more broadly, in society – have an impact on the way in which people and businesses derive value from curb access?
Are the right metrics and monitoring systems in place to measure curb use, productivity and efficiency, and if not, what these might look like?
What implications will these changes have for public authorities, not only from the point of view of regulation, but also from a revenue perspective?
3. Promoting accessibility and inclusivity
Inclusive and accessible mobility will continue to be a focus in 2019, particularly as transportation technology advances and more mobility services are available to travellers. As discussed in my Intelligent Transport article entitled Accessibility and inclusivity: two vital elements of mobility, user needs must drive transport to become more accessible and equitable. For example, in the ATTRI programme mentioned earlier, the technology-enabled services that are critical to meeting this goal and for which applications are being piloted are wayfinding and navigation; pre-trip concierge and virtualisation; safe intersection crossing; and robotics and automation. Further, from an automated vehicle perspective, “machine vision, artificial intelligence (AI), assistive robots and facial recognition software” will be facilitating travel for persons with disabilities. Finally, in terms of equity and inclusion, 2019 will see the technology and policy implications of transport equity begin to be addressed. Given frameworks such as Spatial, Temporal, Economic, Physiological and Social (STEPS) to Transportation Equity, which was developed in the U.S., the opportunities and challenges in the technology and policy areas can be used to begin to implement solutions for disabled, low-income and elderly travelers.
4. Understanding travel behaviour changes
The Business and Operational Impact of Next Gen Planning and Scheduling
New planning and scheduling platforms are changing how public transportation operators and agencies work. This webinar will take a close look at how legacy planning and scheduling force certain practices on operations, and how the introduction of new technologies can transform operations and business results.
Click here to find out more
It was identified in many mobility and transportation technology conferences in 2018 that we need a better understanding of changes in travel behavior as a result of new technology-driven mobility choices. In 2019, it is expected that the following will lead to a better understanding of travel behavior3:
Behavioural science and behavioural design will assist in identifying and proposing those mobility services that could best fit the needs of different types of travellers
Acceptance, adoption of and attitudes toward new mobility services, including Mobility-as-a-Service (MaaS) and automated vehicles, will continue to be studied and determined using techniques such as the Technology Acceptance Model, which measure the influences of perceived risk and enjoyment, and behavioural intention of users
Mobility behaviour is strongly affected by routine behaviour and habits. To change mobility behaviour, existing research in the fields of sociology, psychology and behavioral economics should be considered in MaaS design since they describe a number of biases and heuristics which significantly influence decisions behaviour
The explosion of new mobility services over the last two to three years has added considerable complexity for the traveller, making it much more challenging to model travel behaviour and design systems that meet user needs.
5. Encouraging data sharing
Data sharing continues to be vital for mobility and tools that facilitate mobility, such as MaaS. However, it can be challenging to obtain operational data from private mobility providers, such as ride-sourcing companies (e.g., Uber, Lyft). In 2019, I expect that more local and regional governments will develop policies and introduce legislation requiring operational data resulting from all mobility service providers. This data is critical to understanding not only the market share of various mobility services in a city or region, but also the impact that these services have on public transport. For example, in San Francisco, one of the 10 guiding principles that must be met by all mobility service providers is in the area of accountability: “Service Providers must share data for the city and public to determine the services’ benefits and impacts on transport and whether or not the services’ meet the city and county’s transport goals.” However, legislation addressing data sharing is not without controversy, as evidenced by the rules proposed by the District of Columbia:
A log of trips performed by private vehicle-for-hire operators utilizing the digital dispatch services of the private vehicle-for-hire company in the District, including, for each trip, the point of origin and destination, the date and time of pick-up and drop-off, the stationary time at pick-up and drop-off, the fare paid, whether the trip was on a private or shared service, and the number of passengers in the vehicle.4
Uber and Lyft fought against this draft legislation. Arguments on the other side were that data can be shared with a city of regional government without releasing it to competitors.
The airport welcomed an impressive 89.1 million passengers last year…
For the fifth year in a row Dubai International Airport (DXB) has been named the world’s busiest airport for international travellers. In 2018, DXB saw a record 89.1 million passengers travel through, a growth of one per cent versus the previous year.
Dubai airport has been the world’s busiest for international travellers since 2014, when it took the title from London’s Heathrow.
The airport is known as the hub for airlines Emirates and flydubai and while the number of flights fell slightly by 0.3 per cent (a total of 408,251 flights took off in 2018), the number number of passengers per plane grew to an average of 226 people per plane, according to the airport operator.
Dubai airport has previously said it believes it can overtake Atlantic and Beijing airports to become the world’s busiest overall by 2021.
In a video posted to YouTube, Dubai Airports CEO Paul Griffiths also talked about other key changes DXB had introduced in 2018, which include the opening of Hard Rock Cafe, Candylicious and a Nutella Cafe.
Nine-year-old Arjun, who was traveling with his brother and parents, arrived in Dubai on EK220, a 14-hour flight from Orlando, Florida on Thursday December 20.
The family were met to huge celebrations, and have been told they will “be treated to an incredible 4-day Dubai experience”, according to a Tweet by Dubai Airports


